
Compare saves per reach across Instagram carousels
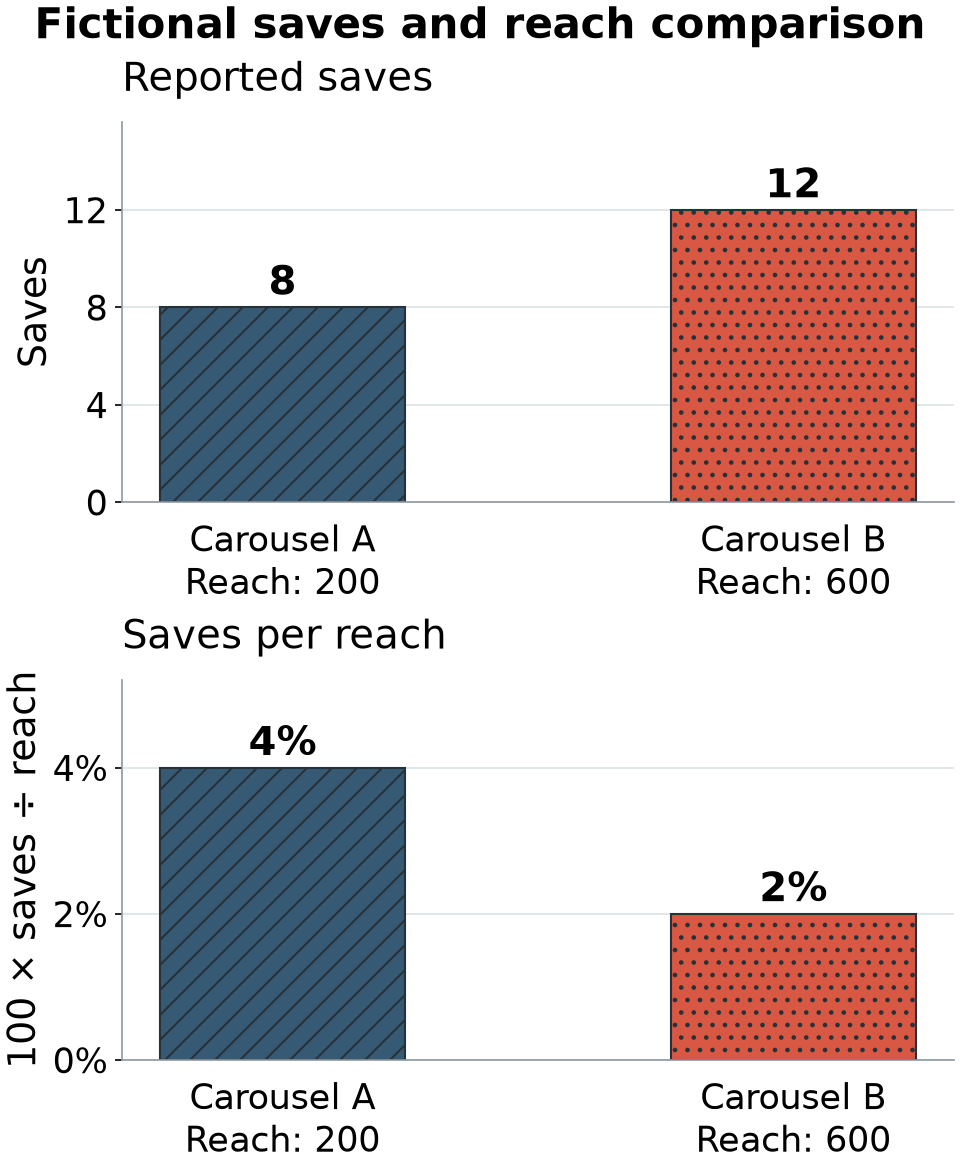
Use the save and reach measures actually reported by your source, with the same definitions and observation window. Calculate 100 × saves ÷ reach, then inspect the underlying counts. A higher ratio and a larger total answer different questions.
Your working document
Worked comparison
| Fictional carousel | Saves | Reach | Saves per reach |
|---|---|---|---|
| Carousel A | 8 | 200 | 4% |
| Carousel B | 12 | 600 | 2% |
Compare the count and the ratio
Use the comparison for the actual decision
If the task is producing more saved material in total, the absolute count matters. If the task is comparing saves relative to the reported reach, the ratio helps describe that relationship. Choose the criterion before looking for a favourable result.
A reach denominator of zero has no defined ratio. Record it as unavailable, not 0%. The downloadable example values are static illustrations; enter the shown formula in the ratio column for your own spreadsheet calculation.
Do not add post-level reach figures and call the sum unique people across the account. Keep the source's definitions and any overlap or reporting gaps visible when aggregating.
Before drawing a conclusion
- The save and reach definitions match.
- Observation windows are comparable.
- Topic, audience and distribution changes are recorded.
- Both counts are visible beside the ratio.
- Fictional example rows are removed from any actual account report.